
Key takeaways
- A shelf-life signal is only valuable if it changes a decision before the product arrives, and Pilot 1 tests that on a live lane of Driscoll's berries moving through Pacific Coast Fresh to a regional retailer.
- Open standards let quality, sensor and model data meet without anyone replacing their systems: GS1 identifiers name the pallet and the place, and EPCIS 2.0 events carry the readings in a format any compliant system can read.
- Order 1 of the pilot's three golden orders (coordinated, closely instrumented orders chosen in advance) showed where hand-offs lose time; the data came together after the fact, so the distributor's assessment is that the decision capability is not yet demonstrated.
- All three orders ran and data was collected, but linking the data and getting near-real-time access fell short of what the team expected, so the pilot is continuing with a phase 2 that adds more automation and better communication between participants.
- You can run a small trial of your own by starting with one lane and one decision, using the checklist in the section How to run your own trial.
Why freshness signals matter
A shelf-life signal is only valuable if it changes a decision before the product arrives. This report describes Pilot 1 of the 2026 SCOTF pilot series, which tests that idea on a live lane. Driscoll’s berries move to a distributor, Pacific Coast Fresh, and on to a regional retailer. Trackers ride with the shipment, and shelf-life models turn the readings into an estimate the distributor can act on.
Quality changes continuously with temperature and handling, and the information needed to manage it is spread across companies. The grower-shipper holds quality at pack. The sensor provider holds the temperature history. The distributor holds the receiving inspection. In the pilot team’s view, a recorder in the load describes what happened to that load, and a decision needs that description combined with quality at pack and a model of how the fruit ages. The distributor sits in the middle of these flows and often receives the product before it receives the answer. The consequences show up as shrink, arrival quality disputes and last-minute reallocation.
Produce losses are large, and temperature is one of the main drivers. USDA’s Economic Research Service estimated that 31 percent of the food supply available at the retail and consumer levels in the United States went uneaten in 2010, 133 billion of 430 billion pounds [8]. That figure covers all foods and not berries alone, so it frames the scale and does not measure the pilot lane. For strawberries, UC Davis reports a respiration rate of 6 to 10 ml of carbon dioxide per kilogram per hour at 0 °C and 50 to 100 at 20 °C, and states that the shelf-life clock runs about ten times faster at room temperature than at 32 °F [10]. Brecht reports that postharvest life falls by one half to two thirds with each 10 °C rise in temperature, and that a delay of two hours at 86 °F before cooling was enough to cause measurable losses [11]. Those findings are about strawberries in general. They explain why a temperature history matters, and they are not pilot results.
Temperature history also matters when an arrival is disputed. Under the US Perishable Agricultural Commodities Act, a buyer is entitled to produce in suitable shipping condition, also called good delivery, meaning it arrives without abnormal deterioration under normal transport conditions. A rejection has to be timely and properly noticed, and unloading or diverting the product, or failing to notify the seller, counts as acceptance. An informal complaint to USDA must be filed within nine months [12]. In a dispute, each party usually holds a different record: the shipper holds quality at pack, the carrier holds a delivery time, the receiver holds an inspection. What the load experienced between those records is often the missing piece. In the pilot team’s view, a continuous temperature record tied to the pallet identifier gives every party the same evidence, earlier, and a shared record is a firmer basis for a dispute than recollection. This is a summary for orientation, not legal advice; the USDA Agricultural Marketing Service sets out the rules.
An estimate of remaining shelf life, delivered early, changes one specific decision. Most distributors move product first in, first out (FIFO). With an estimate, a distributor can move first expired, first out (FEFO): lots with less remaining life go to customers who are close or who turn product quickly, and lots with more remaining life go to customers with longer lead times. Hertog and colleagues describe FEFO as shipping by remaining shelf life relative to the destination, where FIFO assumes that everything that arrives on the same date has the same life. They note that FEFO depends on data sharing among trading partners [9].
Picture two pallets of berries packed on the same day. One rode in a warmer part of the trailer. A first in, first out rule treats them as identical. A freshness estimate would show that one pallet has less life left, so it goes to the store down the road and the other goes on the longer haul. This example is illustrative and is not pilot data.
The pilot asks the question in the distributor’s terms: can it make earlier and calmer allocation and handling decisions, with less defensive behavior and fewer losses, using a trusted freshness signal that arrives before the product does?
What this report covers
Pilot 1 follows three golden orders. A golden order is a coordinated order chosen in advance and followed from pack to store, with each hand-off instrumented and recorded, so the team can compare what the signal said with what happened. This is version 0.9, a draft for industry comment. It covers:
- the concepts you need, in plain language;
- who took part, how the pilot was set up and how data flows;
- how success is measured;
- what order 1 showed, what orders 2 and 3 added, and phase 2;
- a checklist for your own trial, and the questions the industry still has to settle.
Retail sell-through, consumer satisfaction and the accuracy of the sensors themselves are outside the pilot. The report publishes no commercial terms and no pilot datasets.
Concepts in plain language
This section defines the terms the rest of the report uses. If you already work with GS1 identifiers and EPCIS, you can skip to The pilot.
Three identifiers: GTIN, SSCC and GLN
GS1 identification keys give things and places a number that means the same in every company’s system. Three matter here [4].
- A GTIN (Global Trade Item Number) identifies a trade item, such as a clamshell of berries. It can be combined with a batch or lot number or a serial number.
- An SSCC (Serial Shipping Container Code) identifies a logistics unit, such as a pallet. Each pallet carries its own number.
- A GLN (Global Location Number) identifies a location or a party, such as a packing facility or a distribution center.
GS1 defines the keys in its General Specifications [5]. One distinction is worth knowing. An identifier is instance-level when it names exactly one object, as an SSCC does. It is class-level when many objects share it, as a GTIN plus a lot number does [4]. Instance-level identifiers let you recognize that events in two companies’ systems concern the same pallet. The pilot ties every record to the pallet’s SSCC, which lets events from different companies be joined.
EPCIS 2.0: events that answer what, when, where, why and how
EPCIS (Electronic Product Code Information Services) is the GS1 standard for sharing visibility data, which is a record of what happened to identified things, and when and where [3]. One EPCIS event records the completion of one business step, such as shipping, receiving or inspecting. It describes the step along five dimensions [4]:
- What: the objects involved, named by their identifiers.
- When: the event time and the time zone offset in effect.
- Where: the read point (where the event took place) and the business location (where the objects are expected to be afterward), identified by a GLN or by geo-coordinates.
- Why: the business context, including the business step and the disposition, which is the condition of the objects after the event, for example in transit.
- How: optional sensor data.
A companion standard, the Core Business Vocabulary (CBV), supplies agreed values for terms such as business step and disposition. Using the agreed values is what lets a receiver understand an event without a private arrangement with the sender [4].
EPCIS 2.0, released in June 2022, added support for sensor data, a JSON and JSON-LD syntax, a REST interface for capturing and querying events, and GS1 Digital Link URIs for identifiers [3]. Two interfaces matter in practice. A capture interface carries events from the systems that create them to a repository. A query interface lets partners and applications retrieve them [4]. EPCIS sits beside a company’s ERP, warehouse and quality systems rather than replacing them: capture applications at the edge create events and can draw business context from those back-end systems [4]. GS1 publishes the machine-readable files for EPCIS 2.0, including the JSON-LD context and a JSON Schema for checking events [1].
Most events are ObjectEvents, which record something that happened to one or more identified objects, such as a pallet being shipped or received. An AssociationEvent links objects that stay together, and GS1’s own example is attaching a sensor to the container it monitors [4].
The sensor element: how a reading rides on an event
The How dimension carries sensor data in a sensor element. The element holds at least one sensor report and, optionally, sensor metadata [4]. A report can carry a measured value with its unit, such as a temperature in degrees Celsius. It can carry a statistical summary of a period, such as the minimum, maximum and mean. It can also carry a non-numeric value from a smart sensor [4]. Table 1 lists selected fields.
Selected sensor fields in EPCIS 2.0
| Field | What it carries |
|---|---|
| time | The time of the observation |
| deviceID | The device the data came from |
| type | The property measured, such as temperature |
| value | A numeric value |
| uom | The unit of measure |
| minValue, maxValue, meanValue | The minimum, maximum and mean of a property over a period |
| sDev | The standard deviation of the values |
| rawData | The location of the raw sensor data |
| dataProcessingMethod | The location of a document that specifies how the data was processed |
| startTime, endTime | In sensorMetadata, the start and end of the observation period |
The field list is paraphrased from the GS1 Implementation Guideline [4]. The guideline also gives worked examples of sensor events, including proving temperature compliance, sending an exception notice and monitoring the condition of an intermodal transport (section 5.11 of the guideline) [4].
A tracker usually measures the air around it. Where it sits on the pallet or in the trailer changes what its readings mean. In the pilot team’s view, agree on placement before the first run, and follow the placement guidance of your cold chain program or the device maker.
Remaining shelf life and confidence
Remaining shelf life is an estimate of how much usable life a lot has left. A shelf-life model produces it from two kinds of input: how the product started, which is quality at pack, and what has happened since, which is the temperature history. Every estimate carries uncertainty, so the pilot’s model output includes a confidence indicator beside the estimate. Different model families suit different commodities, routes and data. In Pilot 1 the modeling participant chooses the model or models by route, mode and commodity.
The industry does not yet have a published standard method for this. ASTM International subcommittee F49.04 lists proposed new work items on calculating shelf life for fresh goods, determining remaining shelf life, and data capture for shelf-life calculation, and none is an active standard yet [7]. They are drafts and may change. This report does not reproduce or summarize them. Pilot 1 is a demonstration and does not apply a published shelf-life standard.
The pilot: who took part and how it was set up
Participants and roles
The pilot has five participants and a facilitator. Participants appear by role and, where they have approved it, by name. SCOTF endorses no vendor. Naming a company here describes its role in the pilot and is not an endorsement.
Participants and roles
| Role | Participant | What it does in the pilot |
|---|---|---|
| Grower-shipper | Driscoll’s | Records quality at pack and binds each pallet’s quality record to a tracker serial and the pallet’s SSCC |
| Sensor and visibility provider | Tive | Supplies the trackers, which report temperature, location and light at a regular interval during transit |
| Shelf-life modeling | Hemdahl | Chooses the model or models by route, mode and commodity, and returns a remaining-shelf-life estimate with a confidence indicator |
| Distributor | Pacific Coast Fresh | Receives the signal, makes allocation and handling decisions, and runs an independent receiving inspection as ground truth |
| Retailer | A regional retailer (not named) | Checks arrival condition at the store and compares observed shelf life with the expectation |
| Facilitator and data steward | SCOTF, through its technical lead | Assembles the role-filtered signal, holds the pilot dataset under SCOTF data-handling rules, and keeps the schedule and the record |
Each participant owns its data. It shares only the fields agreed for each role, and only for the pilot.
Golden orders
A golden order is a coordinated order chosen in advance and followed from pack to store, with each hand-off instrumented and recorded. Pilot 1 uses three. Each is an order of Driscoll’s berries moving from Driscoll’s to Pacific Coast Fresh to the regional retailer. They are less-than-truckload orders and are not necessarily full loads. Partial loads raise questions that a full truckload hides, such as pickup and drop-off timing and door openings. The distributor’s buyer and the grower-shipper chose orders 2 and 3 together, with a larger sample in mind where possible [13].
Three orders is a small sample. That is a limit of the design. The pilot can show whether the pipeline can deliver a usable signal in time and whether the signal changes a decision. It cannot give statistical estimates of how accurate any model is across the industry.
The data flow
Figure 1 shows the flow from pack to ground truth. The steps are:
- At pack. The grower-shipper records a quality assessment for the lot and attaches a tracker. The quality record and the tracker serial are bound to the pallet’s SSCC.
- In transit. The tracker reports temperature, location and light at a regular interval. Each reading becomes an EPCIS 2.0 sensor event against that SSCC.
- Modeling. The shelf-life model combines quality at pack with the temperature history and returns a remaining-shelf-life estimate with a confidence indicator.
- Signal. SCOTF assembles a role-filtered freshness signal: a freshness band, risk flags and confidence, rather than raw sensor data. The distributor sees the estimated remaining life and an alert flag. It does not see the grower’s commercial data.
- Decision. The distributor uses the signal to allocate, reroute or prioritize the lot before it arrives, and records the decision.
- Ground truth. Receiving inspection at the distributor, and an arrival check at the retailer, are compared with the estimate. Those results feed back as the test of the signal.
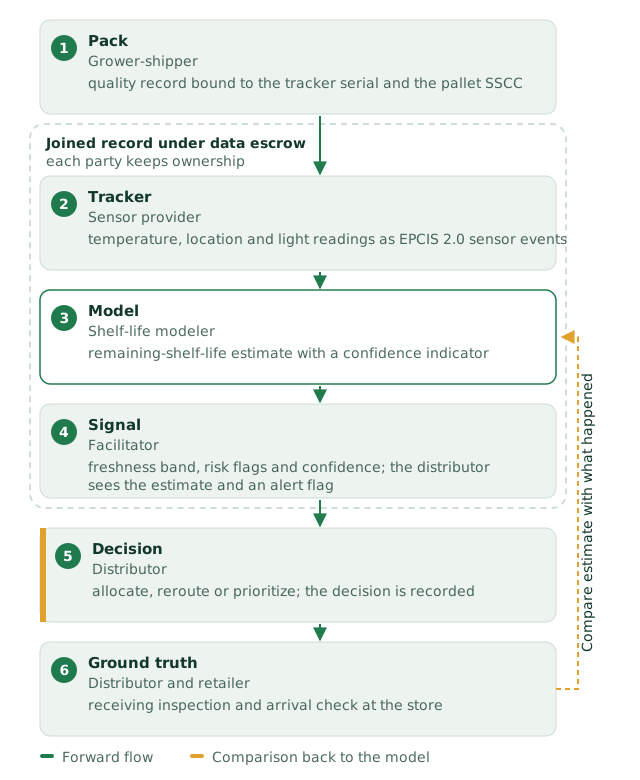
Table 3 lists the data elements at each step.
Data elements captured at each step
| Step | Captured by | Data elements | Joined to the pallet by |
|---|---|---|---|
| 1. At pack | Grower-shipper | Quality record for the lot; tracker serial; pallet SSCC | SSCC and tracker serial recorded together before the truck ships |
| 2. In transit | Sensor provider | Temperature, location and light readings, each with a time and a device ID | Tracker serial; each reading is an EPCIS 2.0 sensor event against the SSCC |
| 3. Modeling | Shelf-life modeler | In: quality at pack and temperature history. Out: remaining-shelf-life estimate and confidence indicator | Pallet SSCC |
| 4. Signal | Facilitator | Freshness band, risk flags and confidence; for the distributor, the estimate and an alert flag | Pallet SSCC |
| 5. Decision | Distributor | The allocation, reroute or prioritization decision, and when it was made | The same pallet or lot reference |
| 6. Ground truth | Distributor and retailer | Receiving inspection result; arrival check and observed shelf life at the store | The same pallet or lot reference |
Facilities are identified by GLN throughout.
Integration approach
Events use the EPCIS 2.0 JSON-LD format with GS1 identifiers: GTIN, SSCC and GLN [1]. Sensor data rides in the EPCIS sensor element, so any compliant system can read it. Figure 2 shows the structure of a sensor event.
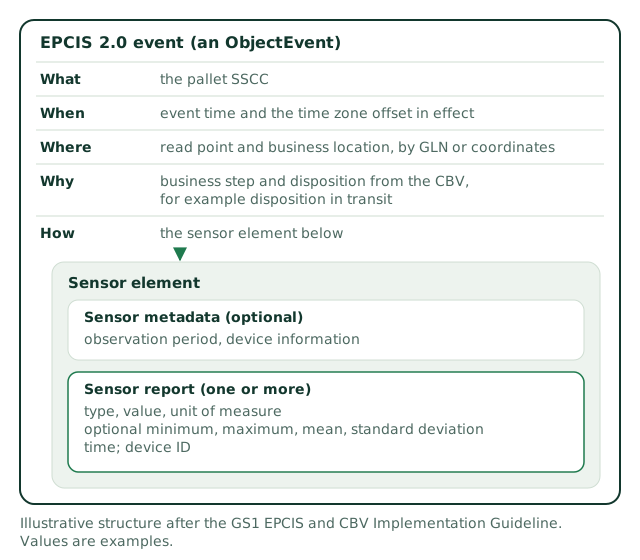
Example. An illustrative sensor event. The event below is a sketch for technology teams. It is not pilot data. The identifiers use the GS1 documentation prefix 0614141, the device identifier is a placeholder, and the values are invented. The sketch validates against the GS1 EPCIS 2.0 JSON Schema. The schema does not check units of measure against the UN/CEFACT code lists, so check those yourself, and test your own events with the GS1 schema [1]. In the JSON the optional element is spelled sensorMetadata, and the readings sit in a list called sensorReport.
{
  "@context": "https://ref.gs1.org/standards/epcis/2.0.0/epcis-context.jsonld",
  "type": "EPCISDocument",
  "schemaVersion": "2.0",
  "creationDate": "2026-10-23T12:00:00.000Z",
  "epcisBody": {
    "eventList": [
      {
        "type": "ObjectEvent",
        "eventTime": "2026-10-23T11:45:00.000-07:00",
        "eventTimeZoneOffset": "-07:00",
        "action": "OBSERVE",
        "bizStep": "sensor_reporting",
        "disposition": "in_transit",
        "epcList": ["urn:epc:id:sscc:0614141.1234567890"],
        "readPoint": { "id": "urn:epc:id:sgln:0614141.00001.0" },
        "sensorElementList": [
          {
            "sensorMetadata": {
              "startTime": "2026-10-23T10:45:00.000-07:00",
              "endTime": "2026-10-23T11:45:00.000-07:00",
              "deviceID": "urn:example:device:tracker-0042"
            },
            "sensorReport": [
              {
                "type": "Temperature",
                "minValue": 1.8,
                "maxValue": 3.4,
                "meanValue": 2.5,
                "uom": "CEL"
              }
            ]
          }
        ]
      }
    ]
  }
}
Reading the sketch from the top: the document declares the EPCIS 2.0 context so that a receiving system can interpret the terms. The event is an ObjectEvent with the action OBSERVE, because the tracker is observing the pallet and not changing anything about it. The business step and disposition come from the CBV [2]. The pallet is named by its SSCC, written here as an EPC URN; the same identifier can be written as a GS1 Digital Link web address, and the choice should be agreed between partners [6]. The location is a GLN-based identifier. The sensor element reports the lowest, highest and mean temperature over one hour, in degrees Celsius, and says which device produced it. A distributor’s model can read those three numbers, together with the pack-time quality record for the same lot, and produce a remaining-life estimate. Anything a participant wants to add that the standard does not define, such as a model confidence score, goes in a user extension declared in the document context, and not in a modified copy of the standard.
Each provider sends data through its existing platform by API or file export, so no participant has to replace a system. GS1 publishes a JSON Schema for checking EPCIS events in JSON or JSON-LD, and a team can use it to test its own events before sharing them [1].
Role-filtered signal and smart data escrow
SCOTF holds the joined record under smart data escrow. Each party contributes its data and keeps ownership, and the joined record releases only the fields agreed for each role. Escrow lets the distributor receive a freshness band and an alert flag without receiving the grower’s commercial data. The pilot’s use of each party’s data is limited to the pilot.
TOTEM LLC is a SCOTF partner and holds interests in data-sharing and attestation technology.
Success measures
The primary measure is one question: would the signal have changed a real allocation or handling decision before the product arrived? Four supporting measures sit beneath it [13].
The four supporting measures look at the question from different angles: whether lots were moved on the signal, whether flagged lots spent less time waiting, whether the alerts were worth acting on, and whether the estimate matched what receiving inspection found. Table 4 lists them and says how each is measured.
The primary question and the four supporting measures
| Measure | What it shows | How it is measured |
|---|---|---|
| Primary question: would the signal have changed a real allocation or handling decision before the product arrived? | Whether the signal was early enough and trusted enough to matter | For each order, the distributor records what the signal said, when it reached the distributor relative to arrival, and whether a decision was made or changed |
| Lots re-allocated or re-prioritized | Whether the signal was acted on | The share of lots moved to a different customer or handled in a different order because of the signal |
| Dwell reduction for at-risk lots | Whether flagged lots moved faster | Dwell time of flagged lots compared with the distributor’s usual dwell time |
| Alerts acted on | Whether the alerts were worth attention | The share of alerts followed by an action |
| Estimate versus receiving QA | Whether the remaining-shelf-life estimate matched what was found | The estimate and its stated confidence compared with the distributor’s receiving inspection |
Targets are the distributor’s to set. This version states none, and no result against any measure is reported.
What order 1 taught us
Order 1: capability not yet demonstrated. The data came together after the fact, too late to act on. That is the distributor's assessment, and we report it as it happened.
Order 1 shipped in mid-September 2026 and ran through September and October. It was planned as a largely retrospective run. Its job was to connect and interrogate the data, stand up the pipeline, and build the dashboard so that later orders could run closer to real time. The plan was to build ingestion ahead of the real data, from a sample of the distributor’s inspection report format, so that the real data could be read as soon as it landed.
The team treats the result as useful. It showed where the hand-offs between quality at pack, the tracker binding and the model output lose time. Table 5 lays out the hand-offs the signal depends on and how each was planned for order 1.
Hand-offs the signal depends on, as planned for order 1
| Hand-off | What had to be in place first | Planned timing for order 1 |
|---|---|---|
| Quality at pack to tracker binding | Pallet-level quality record and tracker serial recorded against the pallet’s SSCC | Tracker serial around shipping; pack quality data at or after shipping |
| Tracker to transit data | Readings available outside the tracker’s own platform | After transit |
| Inputs to model | Quality at pack and temperature history both in hand | After the inputs landed; the model was chosen and run then |
| Model output to signal | Estimate and confidence assembled into a role-filtered signal for the distributor | After the model ran |
| Signal to decision | The signal reaches the distributor with time to act | Product could arrive before analysis was finished; this was a documented risk |
| Decision and ground truth | The distributor records its decision and runs a normal, objective receiving inspection | On arrival |
Two things follow from the table. Each row waits for the one before it, so a delay early in the chain moves every later step. And for order 1, the transit readings were planned to arrive after the trip, so a signal in time to act was not part of the order 1 design.
This version does not give measured times for each hand-off. It reports the decision result only. Accuracy of the estimate against receiving inspection is one of the measures in Table 4, and it is reported across the orders.
The middle rows of Table 5 are where waits accumulate: readings reaching the facilitator while the truck is moving, the model running as readings arrive, and the signal reaching the distributor before the arrival. Those are the hand-offs where automation and clearer communication can shorten the chain, and they are the focus of phase 2.
Orders 2 and 3, and phase 2
Orders 1 to 3 ran, and the team collected data from all three. The aim for orders 2 and 3 was near real time delivery: the signal reaches the distributor while the product is in transit, early enough to change an allocation or handling decision. Linking the data and getting near-real-time access fell short of what the team expected. The pilot therefore continues with a phase 2, which adds more automation and better communication between the participants. As of version 0.9, in October 2026, this report gives no measured results for orders 2 and 3 and does not say that the signal reached the distributor in time to act. Figure 3 shows where the pilot stands.
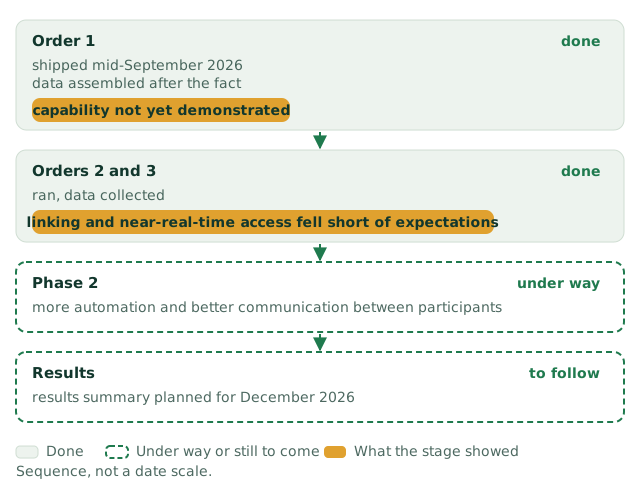
This section has no measured result yet. We will state results as measured, for each order and for phase 2, once the team has analyzed them. A results summary is planned for December 2026. For each we plan to report:
- when the signal reached the distributor, relative to the product’s arrival;
- whether the distributor made or changed a decision on it, and what that decision was;
- what receiving inspection found, compared with the estimate;
- where time was lost along the hand-offs in Table 5.
If a signal arrives after the truck, the report will say so. If an order changes course, the report will give the reason. The pilots run inside live supply chains with seasonal product and conditions that SCOTF does not control, and participants, timing and capture points may change as a result.
How to run your own trial
You can run a small trial on one lane. The first steps need no new technology.
Do the first three items with your QA lead and your distributor or grower this week. They are decisions and agreements that need a meeting and no purchase.
Decide
- Pick one lane: one commodity, one origin, one distributor and one destination.
- Name the decision the signal would change, and who makes it. Allocation, rerouting and receiving-inspection scope are examples.
- Agree what in time means for that decision, as a number of hours before arrival, so you can later say whether the signal was early enough.
Set up
- Assign identifiers: an SSCC for each pallet, a GLN for each facility, and a GTIN with lot for the trade item [4].
- Bind the quality record and the tracker serial to the pallet’s SSCC before the truck leaves.
- Agree tracker placement and the reporting interval with your sensor provider, and follow your program’s or the device maker’s placement guidance.
- Choose the shelf-life model, list its inputs, and agree who runs it and when.
- Decide what each role sees. Send a freshness band and an alert flag to the decision maker, and keep other parties’ commercial data out of the signal.
- Ask each provider whether it can export EPCIS 2.0 events in JSON-LD. If it cannot, agree a file format and who maps it to events. Check events against GS1’s JSON Schema [1].
Run and review
- Record each decision with the time it was made.
- Run an independent receiving inspection as ground truth, as a normal inspection.
- After the first order, list the timestamp at each hand-off, find where time was lost, and fix the longest wait before the second order.
- Compare the estimate, the decision and the inspection result, and write down where they disagree.
Three orders, or a handful of your own, is a small sample. Use it to learn whether the pipeline delivers in time and whether the signal changes a decision. Do not use it to rank models.
Open questions
These are questions for the industry to settle.
- How early is early enough? Allocation, rerouting and inspection each need a different lead time. What lead times do they need, and which lanes can deliver them?
- What is the minimum data for a usable estimate? ASTM subcommittee F49.04 lists a proposed work item on data capture for shelf-life calculation [7]. How should a pilot like this one feed that work?
- Who sets alert thresholds, and who owns an alert? A role-filtered signal needs an agreed rule for when a lot is flagged, and a record of who acted.
- How should a tracker be bound to a pallet in EPCIS? GS1 describes an association pattern for attaching a sensor to what it monitors [4]. Which event and which vocabulary values should produce a binding that every party can read?
- What is a fair test of accuracy on partial loads? Less-than-truckload orders surface door openings and pickup timing, which a full load may hide. How many orders are enough, and how should placement be recorded?
- How can parties share data while each keeps control of it? Escrow is one pattern. What do others need before they would contribute data to a joined record?
Run your own trial with the checklist.
References
- GS1 (2022). EPCIS and CBV 2.0: standard specifications and normative artefacts. EPCIS standard 2.0.1, JSON-LD context and JSON Schema for validation. https://ref.gs1.org/standards/epcis/artefacts
- GS1 (2022). Core Business Vocabulary (CBV) standard. CBV 2.0.0; defines the business step, disposition and other vocabulary values used in EPCIS events. https://ref.gs1.org/standards/cbv/
- GS1 (2022). EPCIS and CBV. GS1 overview page for EPCIS / CBV 2.0 (released June 2022). https://www.gs1.org/epcis
- GS1 (2023). EPCIS and CBV Implementation Guideline. Release 2.0, ratified March 2023. https://ref.gs1.org/guidelines/epcis-cbv
- GS1 (2026). GS1 General Specifications. Release 26.0, January 2026; defines GTIN, SSCC and GLN. https://www.gs1.org/standards/barcodes-epcrfid-id-keys/gs1-general-specifications
- GS1 (2026). GS1 Digital Link URI Syntax. Release 1.7.0, August 2026; web-address form of GS1 identifiers, usable in EPCIS 2.0 events. https://ref.gs1.org/standards/digital-link/uri-syntax/
- ASTM International (2026). Subcommittee F49.04 on Recommended Practices, Guides, and Specifications: standards under its jurisdiction. Lists proposed new work items WK95930, WK95932 and WK95933 on shelf life; drafts under development. https://www.astm.org/jurisdiction-f4904
- USDA Economic Research Service (2014). The Estimated Amount, Value, and Calories of Postharvest Food Losses at the Retail and Consumer Levels in the United States (EIB-121). Buzby, Wells and Hyman; reports that 31 percent of the 2010 retail and consumer food supply, 133 of 430 billion pounds, went uneaten; all foods, not berries alone. https://ers.usda.gov/publications/43836
- Philosophical Transactions of the Royal Society A (2014). Shelf life modelling for first-expired-first-out warehouse management. Hertog, Uysal, McCarthy, Verlinden and Nicolaï; volume 372, article 20130306; FEFO ships by remaining shelf life and depends on data sharing among trading partners. https://doi.org/10.1098/rsta.2013.0306
- UC Davis Postharvest Technology Center (2020). Can you give some guidelines about refrigeration, care and handling of strawberries?. Answer by Jim Gorny; respiration rate by temperature and the statement that shelf life runs about ten times faster at room temperature than at 32 °F. https://postharvest.ucdavis.edu/node/7254
- University of Florida, Horticultural Sciences Department (2019). Postharvest Handling: Impacts on Fruit Quality. J. K. Brecht, WA Small Fruit Conference, Fresh Market Strawberries Session, 5 December 2019; temperature, cooling delay and postharvest life. https://wpcdn.web.wsu.edu/wp-extension/uploads/sites/2093/2019/12/Brecht-Strawberry-Postharvest2019.pdf
- USDA Agricultural Marketing Service (2020). PACA Complaint Process Discussion. Presentation on suitable shipping condition (good delivery), rejection and acceptance, and informal and formal complaints. https://www.ams.usda.gov/sites/default/files/media/Presentation_-_PACA_Complaint_Process_Discussion%5B1%5D.pdf
- Supply Chain of the Future (SCOTF) (2026). Pilot Scope Memos, 2026 Pilot Series. Unpublished deliverable.
About this artifact
Contributor disclosure
TOTEM LLC is a SCOTF partner and holds interests in data-sharing and attestation technology.
© 2026 the contributors. Freshness Indicators: Real-Time EPCIS 2.0 Sensor Capture is licensed under the Creative Commons Attribution-NonCommercial 4.0 International license. Share and adapt it for non-commercial purposes, with attribution. Attribute the contributors and Supply Chain of the Future. Listing a company, product or tool is not an endorsement.
This is a v0.9 community release from the Supply Chain of the Future (SCOTF) initiative, an industry innovation program. It is shared to support industry learning and is open for comment at hello@scotf.org.